Introduction to Zoho Analytics
Data visualization is crucial for monitoring key business metrics, enabling organizations to turn raw data into actionable insights. In today’s data-driven landscape, the sheer amount of information available can be overwhelming. Effective visualization helps businesses identify trends, pinpoint anomalies, and make informed decisions. For instance, a study highlighted that incorporating customized dashboards into marketing strategies allows teams to engage with data more intuitively, fostering a sense of ownership that enhances decision-making processes.
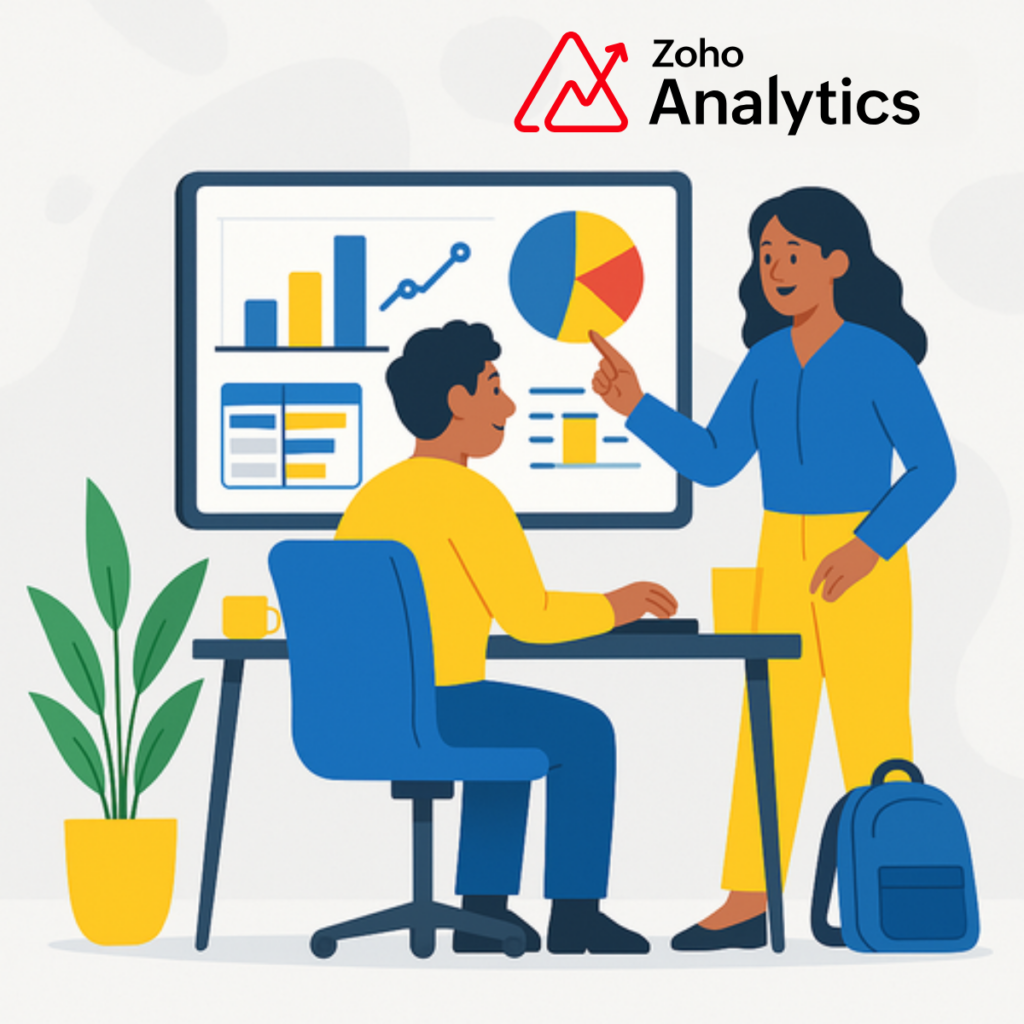
Zoho Analytics stands out as a powerful tool that supports data visualization. Its customizable dashboards allow users to tailor their view of business performance based on specific metrics that matter most to them. Users can combine different data sources to create comprehensive reports, ensuring that critical business insights are readily accessible. This capability not only streamlines data analysis but also fosters collaboration across departments, aligning organizational goals and metrics .
By leveraging Zoho Analytics, businesses can enhance their data storytelling, resulting in a more agile environment capable of adapting to market changes swiftly. This adaptability is essential for navigating complexities in today’s business landscape, where timely decisions can significantly impact success. For more insights on implementing data strategies, check out our article on data governance strategies.
Sales performance dashboard
To effectively track sales metrics like revenue, sales velocity, and win rates, organizations can utilize a Sales Performance Dashboard that integrates key performance indicators (KPIs) and visualizations for actionable insights.
**1. Revenue Tracking:**
The primary metric for any sales dashboard is revenue, which indicates the total income generated from sales. Regularly monitoring revenue streams helps identify trends and forecast future performance. Tools like Zoho CRM enable real-time revenue tracking and adjustments to strategies as needed, enhancing overall financial visibility [Source: Agilean].
**2. Sales Velocity:**
Sales velocity measures how quickly deals progress through the sales pipeline. It gauges the effectiveness of sales efforts by calculating the rate at which revenue is earned from deals closed. Understanding your sales velocity helps identify bottlenecks in the sales process. Implementing automation solutions, like Zoho CRM, assists in streamlining interactions and improving response times, ultimately boosting sales velocity [Source: Agilean].
**3. Win Rates:**
Win rates reflect the percentage of deals that lead to successful sales. A high win rate indicates effective sales tactics and an engaged team. By analyzing win rates against specific benchmarks or customer segments, organizations can enhance their strategies and training approaches. Utilizing customer feedback through platforms integrated with your CRM, such as Zoho, can illuminate areas for improvement [Source: Agilean].
Incorporating these metrics into a cohesive dashboard not only facilitates better decision-making but also optimizes sales strategies, enabling teams to focus on high-impact areas that drive growth. By leveraging tools like Zoho, businesses can further enhance their operational efficiency and adaptability in a competitive market.
Financial overview dashboard
The Financial Overview Dashboard is a crucial tool for organizations seeking to maintain financial health. It focuses on essential indicators such as profit margins, cash flow, and expenditure trends.
**Profit Margins**: Understanding profit margins—both gross and net margins—enables businesses to assess their profitability. A high profit margin indicates efficient management of costs relative to sales. For example, Tapestry’s operating margin was reported at 20.9%, demonstrating effective cost management and strategic positioning within the market.
**Cash Flow**: Monitoring cash flow is vital, as it reflects the operational efficiency and financial stability of an organization. A consistent positive cash flow indicates that a company can sustain its operations and fund growth. A decline in cash flow relative to net income can be a red flag indicating potential financial distress.
**Expenditure Trends**: Analyzing expenditure trends helps in identifying cost-saving opportunities and enhancing budgeting processes. With comprehensive dashboards, organizations can visualize spending patterns across departments, enabling them to make informed decisions. For instance, dashboards integrate various datasets—from operational reports to financial forecasts—promoting clearer decision-making.
Employing these financial indicators effectively within the dashboard ensures that organizations can maintain a robust financial strategy. For more on the significance of financial dashboards, consider exploring our article on [financial automation trends for SMEs](https://agilean.ca/tendances-de-la-finance-automatisee-pour-les-pme-en-2026-et-zoho-dans-tout-ca/).
Customer service insights dashboard
To effectively enhance customer service delivery and experience, it is crucial to leverage a Customer Service Insights Dashboard that focuses on key metrics such as customer satisfaction, response times, and ticket resolutions.
1. **Customer Satisfaction Metrics**: Monitoring customer satisfaction is essential for understanding the effectiveness of service delivery. Organizations can use Net Promoter Score (NPS) or Customer Satisfaction Score (CSAT) to gauge customer sentiment. For instance, companies like Mary Kay, recognized by Forbes for exceptional customer service, demonstrate the impact of placing customer needs at the forefront of strategy, cultivating loyalty and engagement .
2. **Response Times**: Efficient response times are vital for meeting customer expectations. Research indicates that retailers with fast and flexible communication options—like the integration of web chat and messaging apps—can significantly improve their customer satisfaction ratings. The retail industry, for example, struggles with long wait times and limited contact methods, ranking lower in service quality . By investing in technology that enables quicker responses, businesses can better cater to customer demands.
3. **Ticket Resolutions**: Analyzing ticket resolution times provides insight into operational efficiency. A dashboard that tracks the average time taken to resolve inquiries helps identify bottlenecks and inefficiencies. By utilizing data analysis, companies can pinpoint areas for improvement, enhancing their overall service experience. Insurance firms noted for their customer satisfaction have adopted tailored solutions and digital tools, showcasing the importance of adaptability in resolving customer issues .
In summary, adopting a robust Customer Service Insights Dashboard that monitors these core metrics can empower organizations to refine their service delivery processes and elevate customer experiences. By embracing technology and analytics, businesses can meet rising customer expectations and improve satisfaction levels significantly.
Real-time data monitoring dashboard
Employing a real-time data monitoring dashboard is essential for businesses aiming to enhance decision-making and optimize operational efficiency. These dashboards integrate various data feeds, providing stakeholders with instant access to crucial metrics and analytics. This immediacy enables teams to respond swiftly to changing market conditions, improving agility and competitiveness.
For instance, in the retail sector, the influx of data from diverse sources—ranging from web analytics to social media—enables marketers to visualize key performance indicators (KPIs) in real time, fostering informed decisions. By equipping teams with a comprehensive view of the data, organizations cultivate a culture of ownership and accountability regarding insights drawn from these metrics.
Moreover, the integration of AI with real-time data monitoring significantly enhances operational strategies. It allows for predictive analytics and proactive measures, facilitating improved performance across various sectors—including manufacturing—by transforming data into actionable insights. This shift towards automated analytics helps in maintaining data integrity and ensuring compliance, ultimately leading to more informed business strategies.
To leverage these advantages, companies must focus on unifying their data through cloud technologies, ensuring that they can utilize AI and machine learning for real-time insights on demand forecasting, quality assurance, and other critical areas . Thus, implementing a robust real-time data monitoring dashboard is vital for any business seeking operational excellence and effective decision-making.
Forecasting and predictive analytics dashboard
A forecasting and predictive analytics dashboard is an essential tool for businesses seeking to leverage historical data and trends to anticipate future performance. By integrating various data sources—such as sales figures, market trends, and customer behavior—organizations can create accurate predictive models that inform their strategic planning and operational effectiveness.
Research has shown that the workforce analytics and forecasting services market is set to grow significantly, driven by the adoption of data-centric strategies and technologies across industries. This sector is projected to reach USD 25 billion by 2035, reflecting a compound annual growth rate (CAGR) of 5.76% as companies increasingly rely on data for effective human capital management.
In the context of retail, marketers now have access to more data than ever—from online interactions to loyalty programs—feeding into their dashboards daily. This data overload necessitates a clear understanding of what information to prioritize, emphasizing the importance of a unified view of data across teams.
Ultimately, the effective use of forecasting and predictive analytics empowers businesses to make informed decisions, adapt strategies promptly, and enhance overall performance, positioning them for continued success in a competitive landscape. For insights on optimizing workflows and integrating tools like Zoho, check out our articles on leveraging Zoho CRM and achieving digital transformation strategies tailored for SMEs.
Integrating dashboards for holistic insights
Integrating dashboards across sales, finance, and customer service creates a cohesive view of business health, promoting team alignment and informed decision-making. By unifying data from multiple sources, organizations can break down silos and foster collaboration between departments.
1. **Streamlined Data Management**: Integrating dashboards enables teams to visualize a singular view of data, empowering them to understand and act on it collectively. For example, a major benefit noted in retail is how teams utilize data from various channels—such as apps, sales, and social media—to inform strategy, increasing overall engagement and reach.
2. **Enhanced Decision-Making**: Integrated dashboards allow departments to share real-time insights, which can lead to quicker and more effective decision-making. For instance, organizations like ServiceNow are enhancing their platforms to provide automated analytics that link various business processes, enabling teams to shift from simple analysis to actionable insights without switching between systems.
3. **Operational Efficiency**: By using integrated dashboards, businesses can reduce manual data entry and the risks of errors that often occur when transferring data between disparate systems. This increases efficiency by allowing employees to focus on strategic tasks instead of routine data management.
4. **Cross-Departmental Insights**: A unified dashboard can highlight performance metrics across departments, allowing teams to align on common goals and foster a culture of transparency. This cross-functional insight is crucial for identifying opportunities for improvement and optimizing overall performance.
In conclusion, integrating dashboards not only enhances data visibility but also cultivates a culture of collaboration and agility within organizations, aligning efforts across sales, finance, and customer service departments for improved business outcomes.
Conclusion
Implementing dashboards within Zoho Analytics can profoundly enhance business decision-making and support overall growth strategies. These dashboards synthesize vast amounts of data into a cohesive view, providing actionable insights that empower leaders to make data-driven decisions. This capability is crucial for identifying trends, evaluating performance, and optimizing operations.
By utilizing Zoho Analytics dashboards, businesses can track key performance indicators (KPIs), visualize data in real-time, and gain insights into customer behavior and market dynamics. For instance, organizations can connect financial results with operational data, helping to frame their financial discussions in the context of market performance and internal efficiency. This helps shift the conversation from merely assessing costs to understanding the value created, aligning with strategic business objectives.
Furthermore, integrating dashboards facilitates cross-departmental collaboration, fostering a culture of transparency and accountability. As teams engage with the data, they gain ownership and a deeper understanding of their contributions toward business goals. Ultimately, leveraging Zoho Analytics dashboards not only enhances decision-making speed and accuracy but also serves as a catalyst for sustained business growth.
For further exploration of how data tools can drive strategic advantages, consider reading about the impact of digital transformation on business revenue.
- Agilean – Automatisation des ventes et des processus avec Zoho CRM
- Agilean – Optimiser votre workflow avec l’intégration de Zoho Sign et Zoho CRM
- Agilean – Stratégies de collecte et gouvernance des données pour une prise de décision éclairée
- Agilean – Tendances de la finance automatisée pour les PME en 2026 et Zoho dans tout ça
“`
